Data observability has been one of the hottest emerging data engineering technologies the last several years.
This momentum shows no signs of stopping with data quality and reliability becoming a central topic in the data product and AI conversations taking place across organizations of all types and sizes.
Benefits of data observability include:
- Increasing data trust and adoption
- Mitigating operational, reputational, and compliance risks associated with bad data
- Boosting revenue
- Reducing time and resources associated with data quality (more efficient DataOps)
Following Monte Carlo’s creation of the data observability category in 2019, alternative data observability tools have entered the market at various levels of maturity.
In this post, we will share analyst reports and the core evaluation criteria we see organizations use when ranking data observability solutions.
Finally, we’ll share our perspective on alternative data observability vendors, from relative new-comers to open-source stop-gaps.
What are data observability tools?
Data observability refers to an organization’s comprehensive understanding of the health and reliability of their data and data systems. In other words, they help data teams be the first to know when data breaks and how to fix it.
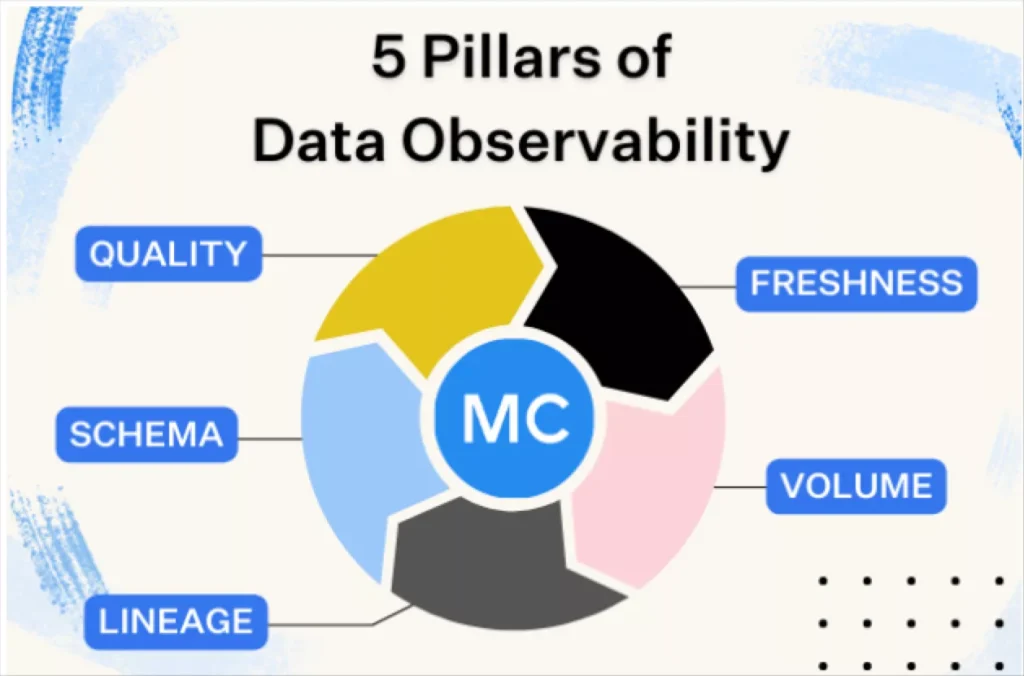
The purpose of data observability tools is to reduce data downtime by automating or accelerating the detection, management and resolution of data quality incidents. The core features of data observability tools were originally defined across five pillars that included four types of machine learning anomaly detection monitors and data lineage:
- Freshness– Did the data arrive when it was expected?
- Volume– Did we receive too many or too few rows?
- Schema– Did the structure of the data change in a way that will break data assets downstream?
- Quality– Are the values of the data itself within a normal range? Has there been a spike in NULLs or a drop in percentage of unique values?
- Lineage– How does the data flow through your tables and systems across your modern data stack? This is critical to both prioritizing incident response and finding the root cause.
If a solution does not have features covering these five pillars then it cannot be considered a data observability tool. However, while the five pillars are essential to the data observability category, they are not the only dimensions through which these tools should be evaluated.
Key features of data observability tools: The analyst perspective
Let’s take a look at what some key industry analysts have pointed to as key evaluation criteria for data observability tools.
Gartner
While Gartner hasn’t produced a data observability magic quadrant or report ranking data observability vendors, they have named it one of the hottest emerging technologies and placed it on the 2023 Data Management Hype Cycle.
They say data and analytics leaders should, “Explore the data observability tools available in the market by investigating their features, upfront setup, deployment models and possible constraints. Also consider how it fits to overall data ecosystems and how it interoperates with the existing tools.”
We anticipate Gartner will continue to evolve and add to their guidance on data observability tools this year.
GigaOm
GigaOm’s Data Observability Radar Report covers the problem data observability tools look to solve saying, “Data observability is critical for countering, if not eliminating, data downtime, in which the results of analytics or the performance of applications are compromised because of unhealthy, inaccurate data.”
The authors include a list of key criteria and a list of evaluation metrics.
Key criteria include:
- Schema change monitoring
- Data pipeline support
- AIOps
- Advanced data quality
- Edge capabilities
Evaluation metrics:
- Contextualization
- Ease of connectability or configurability
- Security and compliance
- BI-like experience
- Reusability
The analyst’s take at the conclusion of the report also highlights the importance of end-to-end coverage and root cause analysis-two features we believe are essential factors for evaluating data observability tools as well.
Ventana
The Ventana Research Buyers Guide does a good job capturing the essence of these tools saying, “data observability tools monitor not just the data in an individual environment for a specific purpose at a given point in time, but also the associated upstream and downstream data pipelines.”
They also used standard dimensions of SaaS platforms in how they ranked vendors:
- Adaptability
- Capability
- Manageability
- Reliability
- Usability
- Customer Experience
- TCO/ROI
- Validation
But, product capability is the highest weighted at 25% of the evaluation. Here Ventana really hit the nail on the head saying that the best data observability solutions go beyond detection to focus on resolution, prevention and other workflows:
“The research largely focuses on how vendors apply data observability and the specific processes where some specialize, such as the detection of data reliability issues, compared to resolution and prevention. Vendors that have more breadth and depth and support the entire set of needs fared better than others. Vendors who specialize in the detection of data reliability issues did not perform as well as the others.”
G2 Crowd
G2 was one of the earliest non-vendor resources to put together a credible list of data observability vendors and a definition for the category. They say:
To qualify for inclusion in the G2 Crowd data observability category, a product must:
- Proactively monitor, alert, track, log, compare, and analyze data for any errors or issues across the entire data stack
- Monitor data at rest and data in motion, and does not require data extraction from current storage location
- Connect to an existing stack without any need to write code or modify data pipelines
Vendors are evaluated by verified users of the product across a list of organizational and product specific capabilities including:
- Quality of support
- Ease of admin
- Ease of use
- Integrations
- Alerting
- Monitoring
- Product direction
- Automation
- Single pane view
Key features of data observability tools: our perspective
Our customer’s needs are never far from our mind when we think of data observability as a category and our own feature roadmap. In addition to the five pillars, we believe the following key value propositions for a data observability solution are:
- Enterprise readiness
- End-to-end coverage
- Seamless incident management
- Integrated data lineage
- Comprehensive root cause analysis
- Quick time-to-value
- AI ready
Let’s take a look at each.
Enterprise readiness
Data is like fashion-it’s ever evolving. You don’t need another vendor, you need a data observability provider that can serve as a strategic advisor. Someone that is going to be innovating alongside you for the long-haul and ensure your operationalization is informed by best practices.
Vendors will promise the world, but can they deliver if they are 12 people in a garage? Will they be around next year?
These are important questions to answer through customer reference calls and an understanding of their overall maturity. As we saw above, these dimensions are also well covered during analyst reviews.
Some key areas to evaluate for enterprise readiness include:
- Security– Do they have SOC II certification? Robust role based access controls?
- Architecture– Do they have multiple deployment options for the level of control over the connection? How does it impact data warehouse/lakehouse performance?
- Usability– This can be subjective and superficial during a committee POC so it’s important to balance this with the perspective from actual users. Otherwise you might over-prioritize how pretty an alert appears versus aspects that will save you time such as ability to bulk update incidents or being able to deploy monitors-as-code.
- Scalability– This is important for small organizations and essential for larger ones. We all know the nature of data and data-driven organizations lends itself to fast, and at times unexpected growth. What are the largest deployments? Has this organization proven its ability to grow alongside its customer base? Other key features here include things like ability to support domains, reporting, change logging, and more. These typically aren’t flashy features so many vendors don’t prioritize them.
- Support– Data observability isn’t just a technology, it’s an operational process. The maturity of the vendor’s customer success organization can impact your level of success as can support SLAs (the vendor doesn’t even have support SLAs? Red flag!).
- Innovation history and roadmap– The data world changes rapidly and as we enter the AI era, you need a partner that has a history of being on the forefront of these trends. Fast followers are often anything but, with comparative features shipped 6 months to a year later. That’s 25 in chief data officer years! Cloud-native solutions often have a leg up here.
End-to-end coverage
The true power of data observability tools lies in its ability to integrate across modern data platform layers to create end-to-end visibility into your critical pipelines.
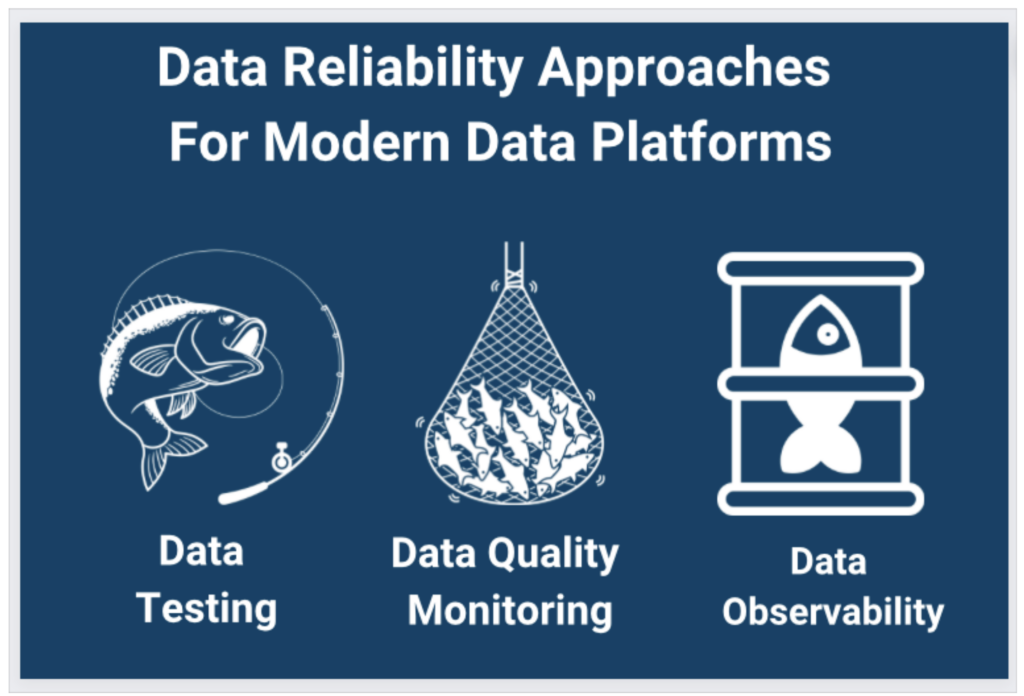
Don’t fish with a line, shoot fish in a barrel. (Yes, we have reasoning behind this convoluted analogy).
For years, data testing-whether it was hardcoded, dbt tests, or some other type of unit test-was the primary mechanism to catch bad data.
While still relevant in the right context, the problem with data testing as a complete practice is that you couldn’t possibly write a test for every single way your data could break. No matter how well you know your pipelines, unknown unknowns will still be a fact of life. And even if you could identify every potential break (which you can’t), you certainly wouldn’t be able to scale your testing to account for each one as your environment grew. That leaves a lot of cracks in your pipelines to fill.
Data observability tools should offer both broad automated metadata monitoring across all the tables once they have been added to your selected schemas, as well as deep monitoring for issues inherent in the data itself.
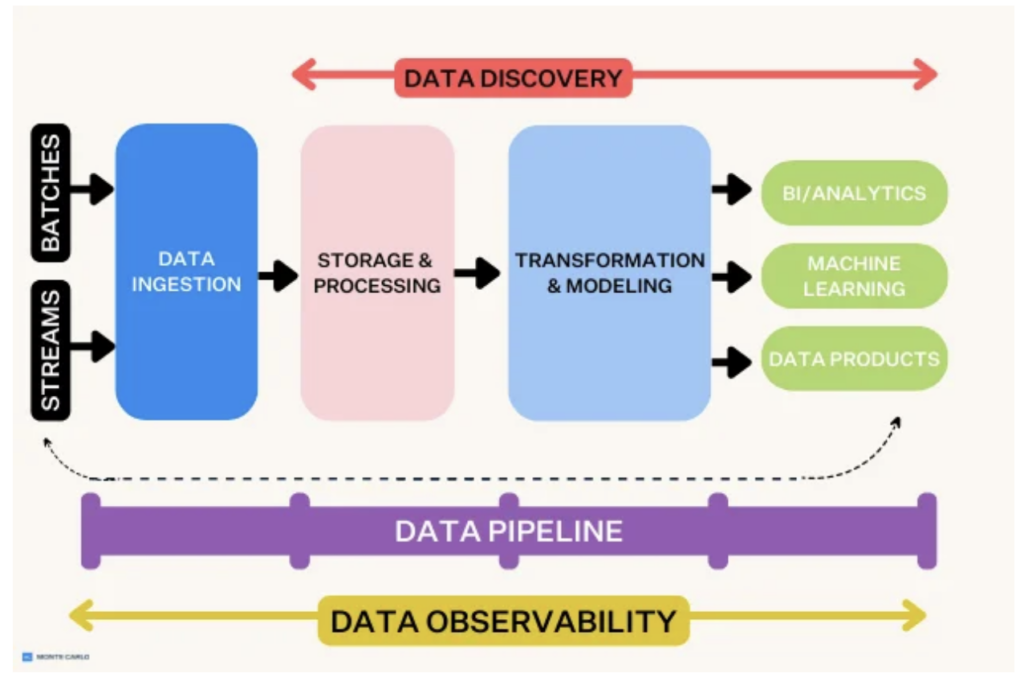
A strong data observability tool will also integrate widely and robust across your modern data platform, from ingestion to BI and consumption, and enable quick time-to-value through simple plug and play integrations.
Be sure to verify that your chosen solution offers tooling integrations for each of the layers you’ll need to monitor in order to validate the quality of your data products, as well as integrations into existing workflows with tools like Slack, Microsoft Teams, Jira, and GitHub. Speaking of..
Seamless incident management
Most data teams we talk to initially have a detection focused mind-set as it relates to data quality, likely formed from their experience with data testing.
The beauty of data observability is that not only can you catch more meaningful incidents, but the best solutions will also include features that improve and accelerate your ability to manage incidents. Bad data is inevitable and having tools to mitigate its impact provides tremendous value.
There are a few areas to evaluate when it comes to incident management:
- Impact analysis: How do you know if an incident is critical and requires prioritizing? Easy-you look at the impact. Data observability tools that provide automated column-level lineage out-of-the-box will also sometimes provide an impact radius dashboard to illustrate how far a quality issue has extended from its root. This can help data engineers understand at a glance how many teams or products have been impacted by a particular issue and who needs to be kept informed as it moves through triage and resolution.
- Internal team collaboration: Once an alert has triggered there needs to be a process for assigning and potentially transferring ownership surrounding the incident. This may involve integrating with external ticket management solutions like JIRA or ServiceNow, or some teams may choose to manage the incident lifecycle within the data observability tool itself. Either way, it’s helpful to have the flexibility to do both.
- Proactive communication with data consumers: When consumers use bad data to make decisions, you lose data trust. Data observability solutions should have means for proactively communicating with data consumers the current health of particular datasets or data products.
Comprehensive root cause analysis
What is your standard root cause analysis process? Does it feel disjointed hopping across multiple tools? How long does it take to resolve an issue?
Data can go bad in a lot of ways. A comprehensive data observability tool should help you identify if the root cause is an issue with the data, system, or code.
For example, the data can be bad from the source. If an application went buggy and you started seeing an abnormally low sales price from orders in New York, that would be considered a data issue.
Alternatively, a data environment is made up of a panoply of irreducibly complex systems that all need to work in tandem to deliver valuable data products for your downstream consumers. Sometimes the issue is hidden within this web of dependencies. If you had an Airflow job that caused your data to fail, the real culprit wouldn’t be the data but a system issue.
Or if a bad dbt model or data warehouse query change ultimately broke the data product downstream, that would be considered a code issue.
A thorough data observability tool would be able to accurately identify these issues and provide the proper context to help your team remediate each at its source.
Integrated column-level data lineage
Lineage is a dependency map that allows you to visualize the flow of data through your pipelines and simplify root cause analysis and remediation.
While a variety of tools like dbt will provide lineage mapping at the table level, very few extend that lineage into the columns of a table or show how that data flows across all of your systems. Sometimes called “field-level lineage,” column-level lineage maps the dependencies between data sets and tables across data products to understand visually how data moves through your pipelines.
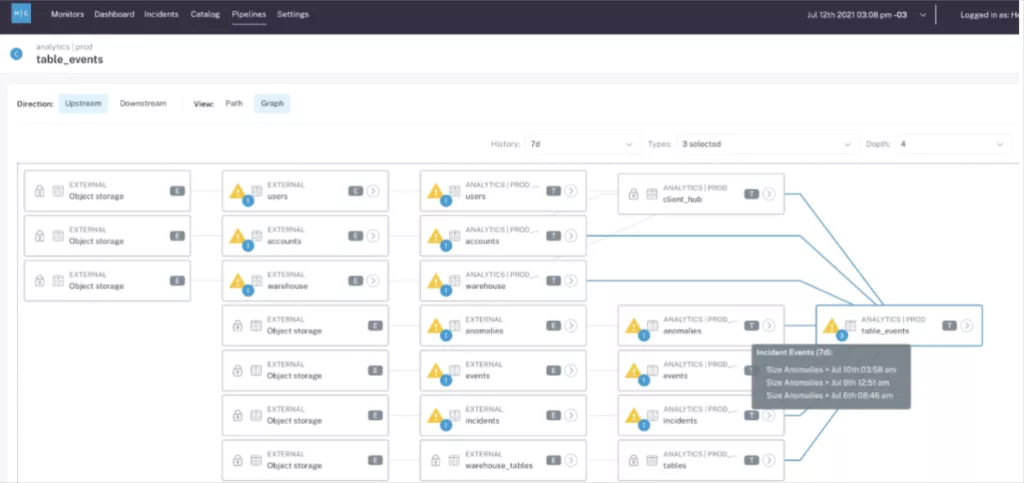
In this scenario, a data observability solution with lineage may send 1 alert whereas a data quality solution without lineage may send 13.
It’s also important that your data lineage and data incident detection features work as an integrated solution within the same platform. A key reason for this is that lineage grouped alerting not only reduces alert fatigue, but helps tell a more cohesive story when an event impacts multiple tables.
Rather than getting 12 jumbled chapters that may be part of one or two stories, you are getting an alert with the full story and table of contents.
Quick Time To Value
Data observability is intended to reduce work-not to add more.
If a data observability tool is providing the right integrations and automated monitors for your environment out-of-the-box, it will be quick to implement and deliver near immediate time-to-value for data teams.
A data observability solution that requires more than an hour to get set up and more than a couple of days to start delivering value, is unlikely to deliver the data quality efficiencies that a growing data organization would require to scale data quality long-term.
AI ready
Building differentiated, useful generative AI applications requires first party data. That means data engineers and high quality data are integral to the solution.
Most data observability solutions today will monitor the data pipelines powering RAG or fine tuning use cases-they are essentially the same as data pipelines powering other data products such as dashboards, ML applications, or customer facing data.
However, the generative AI ecosystem is evolving rapidly and your data observability vendor needs to be not just monitoring this evolution but helping to lead the charge. That means features like observability for vector databases, streaming data sources, and ensuring pipelines are as performant as possible.
What’s the future of data observability tools?
There’s one critical feature that we didn’t mention earlier, that plays a huge role in the long-term viability of a data observability solution. And that’s category leadership.
Like any piece of enterprise software, you aren’t just making a decision for the here and now-you’re making a bet on the future as well.
When you choose a data observability solution, you’re making a statement about the vision of that company and how closely it aligns to your own long-term goals. “Will this partner make the right decisions to continue to provide adequate data quality coverage as the data landscape changes and my own needs expand?”
Particularly as AI proliferates, having a solution that will innovate when and how you need it is equally as important as what that platform offers today.
Not only has Monte Carlo been named a proven category leader by the likes of G2, Gartner, Ventana, and the industry at large; but with a commitment to support vector databases for RAG and help organizations across industries power the future of market-ready enterprise AI, Monte Carlo has become the de facto leader for AI reliability as well.
There’s no question that AI is a data product. And with a mission to power data quality for your most critical data products, Monte Carlo is committed to helping you deliver the most reliable and valuable AI products for your stakeholders.
This article was originally published here.
The post How to Evaluate the Best Data Observability Tools appeared first on Datafloq.
