
 Recently I was working with a customer wherein our focus was to carry out a performance audit of their multiple MySQL database nodes. We started looking into the stats of the performance schema. While working, the customer raised two interesting questions: how can he make complete use of the performance schema, and how can he find what he requires? I realized that it is important to understand the insights of the performance schema and how we can make effective use of it. This blog should make it easier to understand for everyone.
The performance schema is an engine in MySQL which can easily be checked whether enabled or not using SHOW ENGINES. It is entirely built upon various sets of instruments (also can be called event names) each serving different purposes.
Instruments are the main part of the performance schema. It is useful when I want to investigate a problem and its root causes. Some of the examples are listed below (but not limited to) :
1. Which IO operation is causing MySQL to slow down?
2. Which file a process/thread is mostly waiting for?
3. At which execution stage is a query taking time, or how much time will an alter command will take?
4. Which process is consuming most of the memory or how to identify the cause of memory leakage?
What is an instrument in terms of performance schema?
Instruments are a combination of different sets of components like wait, io, sql, binlog, file, etc. If we combine these components, they become a meaningful tool to help us troubleshoot different issues. For example, wait/io/file/sql/binlog is one of the instruments providing information regarding the wait and I/O details on binary log files. Instruments are being read from left and then components will be added with delimiter “/”. The more components we add to the instrument, the more complex or more specific it becomes, i.e. the more lengthy the instrument is, the more complex it goes.
You can locate all instruments available in your MySQL version under table setup_instruments. It is worth noting that every version of MySQL has a different number of instruments.
select count(1) from performance_schema.setup_instruments; +----------+ | count(1) | +----------+ | 1269 | +----------+
For easy understanding, instruments can be divided into seven different parts as shown below. The MySQL version I am using here is 8.0.30. In earlier versions, we used to have only four, so expect to see different types of instruments in case you are using different/lower versions.
select distinct(substring_index(name,'/',1)) from performance_schema.setup_instruments; +-------------------------------+ | (substring_index(name,'/',1)) | +-------------------------------+ | wait | | idle | | stage | | statement | | transaction | | memory | | error | +-------------------------------+ 7 rows in set (0.01 sec)
-
- Stage – Instrument starting with ‘stage’ provides the execution stage of any query like reading data, sending data, altering table, checking query cache for queries, etc. For example stage/sql/altering table.
- Wait – Instrument starting with ‘wait’ falls here. Like mutex waiting, file waiting, I/O waiting, and table waiting. Instrument for this can be wait/io/file/sql/map.
- Memory – Instrument starting from “memory” providing information regarding memory usage on a per-thread basis. For example memory/sql/MYSQL_BIN_LOG
- Statement – Instruments starting with “statement” provide information about the type of SQL, and stored procedures.
- Idle – provide information on socket connection and information related to a thread.
- Transaction – Provide information related to the transactions and have only one instrument.
- Error – This single instrument provides information related to the errors generated by user activities. There are no further components attached to this instrument.
The total number of instruments for these seven components is listed below. You can identify these instruments starting with these names only.
select distinct(substring_index(name,'/',1)) as instrument_name,count(1) from performance_schema.setup_instruments group by instrument_name; +-----------------+----------+ | instrument_name | count(1) | +-----------------+----------+ | wait | 399 | | idle | 1 | | stage | 133 | | statement | 221 | | transaction | 1 | | memory | 513 | | error | 1 | +-----------------+----------+
How to find which instrument you need
I do remember that a customer asked me since there are thousands of instruments available, how can he find out which one he requires. As I mentioned before that instruments are being read from left to right, we can find out which instrument we require and then find its respective performance.
For example – I need to observe the performance of redo logs (log files or WAL files) of my MySQL instance and need to check if threads/connections need to wait for the redo log files to be flushed before further writing and if so then how much.
select * from setup_instruments where name like '%innodb_log_file%'; +-----------------------------------------+---------+-------+------------+------------+---------------+ | NAME | ENABLED | TIMED | PROPERTIES | VOLATILITY | DOCUMENTATION | +-----------------------------------------+---------+-------+------------+------------+---------------+ | wait/synch/mutex/innodb/log_files_mutex | NO | NO | | 0 | NULL | | wait/io/file/innodb/innodb_log_file | YES | YES | | 0 | NULL | +-----------------------------------------+---------+-------+------------+------------+---------------+
Here you see that I have two instruments for redo log files. One is for the mutex stats on the redo log files and the second is for the IO wait stats on the redo log files.
Example two – You need to find out those operations or instruments for which you can calculate the time required i.e. how much time a bulk update will take. Below are all the instruments that help you to locate the same.
select * from setup_instruments where PROPERTIES='progress'; +------------------------------------------------------+---------+-------+------------+------------+---------------+ | NAME | ENABLED | TIMED | PROPERTIES | VOLATILITY | DOCUMENTATION | +------------------------------------------------------+---------+-------+------------+------------+---------------+ | stage/sql/copy to tmp table | YES | YES | progress | 0 | NULL | | stage/sql/Applying batch of row changes (write) | YES | YES | progress | 0 | NULL | | stage/sql/Applying batch of row changes (update) | YES | YES | progress | 0 | NULL | | stage/sql/Applying batch of row changes (delete) | YES | YES | progress | 0 | NULL | | stage/innodb/alter table (end) | YES | YES | progress | 0 | NULL | | stage/innodb/alter table (flush) | YES | YES | progress | 0 | NULL | | stage/innodb/alter table (insert) | YES | YES | progress | 0 | NULL | | stage/innodb/alter table (log apply index) | YES | YES | progress | 0 | NULL | | stage/innodb/alter table (log apply table) | YES | YES | progress | 0 | NULL | | stage/innodb/alter table (merge sort) | YES | YES | progress | 0 | NULL | | stage/innodb/alter table (read PK and internal sort) | YES | YES | progress | 0 | NULL | | stage/innodb/alter tablespace (encryption) | YES | YES | progress | 0 | NULL | | stage/innodb/buffer pool load | YES | YES | progress | 0 | NULL | | stage/innodb/clone (file copy) | YES | YES | progress | 0 | NULL | | stage/innodb/clone (redo copy) | YES | YES | progress | 0 | NULL | | stage/innodb/clone (page copy) | YES | YES | progress | 0 | NULL | +------------------------------------------------------+---------+-------+------------+------------+---------------+
The above instruments are the ones for which progress can be tracked.
How to prepare these instruments to troubleshoot the performance issues
To take advantage of these instruments, they need to be enabled first to make the performance schema log-related data. In addition to logging the information of running threads, it is also possible to maintain the history of such threads (statement/stages or any particular operation). Let’s see, by default, how many instruments are enabled in the version I am using. I have not enabled any other instrument explicitly.
select count(*) from setup_instruments where ENABLED='YES'; +----------+ | count(*) | +----------+ | 810 | +----------+ 1 row in set (0.00 sec)
The below query lists the top 30 enabled instruments for which logging will take place in the tables.
select * from performance_schema.setup_instruments where enabled='YES' limit 30; +---------------------------------------+---------+-------+------------+------------+---------------+ | NAME | ENABLED | TIMED | PROPERTIES | VOLATILITY | DOCUMENTATION | +---------------------------------------+---------+-------+------------+------------+---------------+ | wait/io/file/sql/binlog | YES | YES | | 0 | NULL | | wait/io/file/sql/binlog_cache | YES | YES | | 0 | NULL | | wait/io/file/sql/binlog_index | YES | YES | | 0 | NULL | | wait/io/file/sql/binlog_index_cache | YES | YES | | 0 | NULL | | wait/io/file/sql/relaylog | YES | YES | | 0 | NULL | | wait/io/file/sql/relaylog_cache | YES | YES | | 0 | NULL | | wait/io/file/sql/relaylog_index | YES | YES | | 0 | NULL | | wait/io/file/sql/relaylog_index_cache | YES | YES | | 0 | NULL | | wait/io/file/sql/io_cache | YES | YES | | 0 | NULL | | wait/io/file/sql/casetest | YES | YES | | 0 | NULL | | wait/io/file/sql/dbopt | YES | YES | | 0 | NULL | | wait/io/file/sql/ERRMSG | YES | YES | | 0 | NULL | | wait/io/file/sql/select_to_file | YES | YES | | 0 | NULL | | wait/io/file/sql/file_parser | YES | YES | | 0 | NULL | | wait/io/file/sql/FRM | YES | YES | | 0 | NULL | | wait/io/file/sql/load | YES | YES | | 0 | NULL | | wait/io/file/sql/LOAD_FILE | YES | YES | | 0 | NULL | | wait/io/file/sql/log_event_data | YES | YES | | 0 | NULL | | wait/io/file/sql/log_event_info | YES | YES | | 0 | NULL | | wait/io/file/sql/misc | YES | YES | | 0 | NULL | | wait/io/file/sql/pid | YES | YES | | 0 | NULL | | wait/io/file/sql/query_log | YES | YES | | 0 | NULL | | wait/io/file/sql/slow_log | YES | YES | | 0 | NULL | | wait/io/file/sql/tclog | YES | YES | | 0 | NULL | | wait/io/file/sql/trigger_name | YES | YES | | 0 | NULL | | wait/io/file/sql/trigger | YES | YES | | 0 | NULL | | wait/io/file/sql/init | YES | YES | | 0 | NULL | | wait/io/file/sql/SDI | YES | YES | | 0 | NULL | | wait/io/file/sql/hash_join | YES | YES | | 0 | NULL | | wait/io/file/mysys/proc_meminfo | YES | YES | | 0 | NULL | +---------------------------------------+---------+-------+------------+------------+---------------+
As I mentioned previously, it is also possible to maintain the history of the events. For example, if you are running a load test and want to analyze the performance of queries post its completion, you need to activate the below consumers if not activated yet.
select * from performance_schema.setup_consumers; +----------------------------------+---------+ | NAME | ENABLED | +----------------------------------+---------+ | events_stages_current | YES | | events_stages_history | YES | | events_stages_history_long | YES | | events_statements_cpu | YES | | events_statements_current | YES | | events_statements_history | YES | | events_statements_history_long | YES | | events_transactions_current | YES | | events_transactions_history | YES | | events_transactions_history_long | YES | | events_waits_current | YES | | events_waits_history | YES | | events_waits_history_long | YES | | global_instrumentation | YES | | thread_instrumentation | YES | | statements_digest | YES | +----------------------------------+---------+
Note – The top 15 records in the above rows are self-explanatory, but the last one for digest means to allow the digest text for SQL statements. By digest I mean, grouping similar queries and showing their performance. This is being done by hashing algorithms.
Let’s say, you want to analyze the stages of a query that is spending most of the time in, you need to enable the respective logging using the below query.
MySQL> update performance_schema.setup_consumers set ENABLED='YES' where NAME='events_stages_current'; Query OK, 1 row affected (0.00 sec) Rows matched: 1 Changed: 1 Warnings: 0
How to take advantage of the performance schema?
Now that we know what instruments are, how to enable them, and the amount of data we want to store in, it’s time to understand how to make use of these instruments. To make it easier to understand I have taken the output of a few instruments from my test cases as it won’t be possible to cover all as there are more than a thousand instruments.
Please note that to generate the fake load, I used sysbench (if you are not familiar with it, read about it here) to create read and write traffic using the below details :
lua : oltp_read_write.lua Number of tables : 1 table_Size : 100000 threads : 4/10 rate - 10
As an example, think about a case when you want to find out where memory is getting utilized. To find out this, let’s execute the below query in the table related to the memory.
select * from memory_summary_global_by_event_name order by SUM_NUMBER_OF_BYTES_ALLOC desc limit 3\G; *************************** 1. row *************************** EVENT_NAME: memory/innodb/buf_buf_pool COUNT_ALLOC: 24 COUNT_FREE: 0 SUM_NUMBER_OF_BYTES_ALLOC: 3292102656 SUM_NUMBER_OF_BYTES_FREE: 0 LOW_COUNT_USED: 0 CURRENT_COUNT_USED: 24 HIGH_COUNT_USED: 24 LOW_NUMBER_OF_BYTES_USED: 0 CURRENT_NUMBER_OF_BYTES_USED: 3292102656 HIGH_NUMBER_OF_BYTES_USED: 3292102656 *************************** 2. row *************************** EVENT_NAME: memory/sql/THD::main_mem_root COUNT_ALLOC: 138566 COUNT_FREE: 138543 SUM_NUMBER_OF_BYTES_ALLOC: 2444314336 SUM_NUMBER_OF_BYTES_FREE: 2443662928 LOW_COUNT_USED: 0 CURRENT_COUNT_USED: 23 HIGH_COUNT_USED: 98 LOW_NUMBER_OF_BYTES_USED: 0 CURRENT_NUMBER_OF_BYTES_USED: 651408 HIGH_NUMBER_OF_BYTES_USED: 4075056 *************************** 3. row *************************** EVENT_NAME: memory/sql/Filesort_buffer::sort_keys COUNT_ALLOC: 58869 COUNT_FREE: 58868 SUM_NUMBER_OF_BYTES_ALLOC: 2412676319 SUM_NUMBER_OF_BYTES_FREE: 2412673879 LOW_COUNT_USED: 0 CURRENT_COUNT_USED: 1 HIGH_COUNT_USED: 13 LOW_NUMBER_OF_BYTES_USED: 0 CURRENT_NUMBER_OF_BYTES_USED: 2440 HIGH_NUMBER_OF_BYTES_USED: 491936 Above are the top three records, showing where the memory is getting mostly utilized.
Instrument memory/innodb/buf_buf_pool is related to the buffer pool which is utilizing 3 GB and we can fetch this information from SUM_NUMBER_OF_BYTES_ALLOC. Another data that is also important for us to consider is CURRENT_COUNT_USED which tells us how many blocks of data have been currently allocated and once work is done, the value of this column will be modified. Looking at the stats of this record, consumption of 3GB is not a problem since MySQL uses a buffer pool quite frequently ( for example, while writing data, loading data, modifying data, etc.). But the problem rises, when you have memory leakage issues or the buffer pool is not getting used. In such cases, this instrument is quite useful to analyze.
Looking at the second instrument memory/sql/THD::main_mem_root which is utilizing 2G, is related to the sql (that’s how we should read it from the very left). THD::main_mem_root is one of the thread classes. Let us try to understand this instrument:
THD represent thread
main_mem_root is a class of mem_root. MEM_ROOT is a structure being used to allocate memory to threads while parsing the query, during execution plans, during execution of nested queries/sub-queries and other allocations while query execution. Now, in our case we want to check which thread/host is consuming memory so that we can further optimize the query. Before digging down further, let’s understand the 3rd instrument first which is an important instrument to look for.
memory/sql/filesort_buffer::sort_keys – As I mentioned earlier, instrument names should be read starting from left. In this case, it is related to memory allocated to sql. The next component in this instrument is filesort_buffer::sort_keys which is responsible for sorting the data (it can be a buffer in which data is stored and needs to be sorted. Various examples of this can be index creation or normal order by clause)
It’s time to dig down and analyze which connection is using this memory. To find out this, I have used table memory_summary_by_host_by_event_name and filtered out the record coming from my application server.
select * from memory_summary_by_host_by_event_name where HOST='10.11.120.141' order by SUM_NUMBER_OF_BYTES_ALLOC desc limit 2\G; *************************** 1. row *************************** HOST: 10.11.120.141 EVENT_NAME: memory/sql/THD::main_mem_root COUNT_ALLOC: 73817 COUNT_FREE: 73810 SUM_NUMBER_OF_BYTES_ALLOC: 1300244144 SUM_NUMBER_OF_BYTES_FREE: 1300114784 LOW_COUNT_USED: 0 CURRENT_COUNT_USED: 7 HIGH_COUNT_USED: 39 LOW_NUMBER_OF_BYTES_USED: 0 CURRENT_NUMBER_OF_BYTES_USED: 129360 HIGH_NUMBER_OF_BYTES_USED: 667744 *************************** 2. row *************************** HOST: 10.11.120.141 EVENT_NAME: memory/sql/Filesort_buffer::sort_keys COUNT_ALLOC: 31318 COUNT_FREE: 31318 SUM_NUMBER_OF_BYTES_ALLOC: 1283771072 SUM_NUMBER_OF_BYTES_FREE: 1283771072 LOW_COUNT_USED: 0 CURRENT_COUNT_USED: 0 HIGH_COUNT_USED: 8 LOW_NUMBER_OF_BYTES_USED: 0 CURRENT_NUMBER_OF_BYTES_USED: 0 HIGH_NUMBER_OF_BYTES_USED: 327936
Event name memory/sql/THD::main_mem_root has consumed more than 1G memory ( sum ) by the host 11.11.120.141 which is my application host at the time of executing this query. Now since we know that this host is consuming memory, we can dig down further to find out the queries like nested or subquery and then try to optimize it.
Similarly, if we see the memory allocation by filesort_buffer::sort_keys is also more than 1G (total) at the time of execution. Such instruments signal us to refer to any queries using sorting i.e. order by clause.
Time to join all dotted lines
Let’s try to find out the culprit thread in one of the cases where most of the memory is being utilized by the file sort. The first query helps us in finding the host and event name (instrument):
select * from memory_summary_by_host_by_event_name order by SUM_NUMBER_OF_BYTES_ALLOC desc limit 1\G; *************************** 1. row *************************** HOST: 10.11.54.152 EVENT_NAME: memory/sql/Filesort_buffer::sort_keys COUNT_ALLOC: 5617297 COUNT_FREE: 5617297 SUM_NUMBER_OF_BYTES_ALLOC: 193386762784 SUM_NUMBER_OF_BYTES_FREE: 193386762784 LOW_COUNT_USED: 0 CURRENT_COUNT_USED: 0 HIGH_COUNT_USED: 20 LOW_NUMBER_OF_BYTES_USED: 0 CURRENT_NUMBER_OF_BYTES_USED: 0 HIGH_NUMBER_OF_BYTES_USED: 819840
Ahan, this is my application host, and let’s find out which user is executing and its respective thread id.
select * from memory_summary_by_account_by_event_name where HOST='10.11.54.152' order by SUM_NUMBER_OF_BYTES_ALLOC desc limit 1\G; *************************** 1. row *************************** USER: sbuser HOST: 10.11.54.152 EVENT_NAME: memory/sql/Filesort_buffer::sort_keys COUNT_ALLOC: 5612993 COUNT_FREE: 5612993 SUM_NUMBER_OF_BYTES_ALLOC: 193239513120 SUM_NUMBER_OF_BYTES_FREE: 193239513120 LOW_COUNT_USED: 0 CURRENT_COUNT_USED: 0 HIGH_COUNT_USED: 20 LOW_NUMBER_OF_BYTES_USED: 0 CURRENT_NUMBER_OF_BYTES_USED: 0 HIGH_NUMBER_OF_BYTES_USED: 819840 select * from memory_summary_by_thread_by_event_name where EVENT_NAME='memory/sql/Filesort_buffer::sort_keys' order by SUM_NUMBER_OF_BYTES_ALLOC desc limit 1\G; *************************** 1. row *************************** THREAD_ID: 84 EVENT_NAME: memory/sql/Filesort_buffer::sort_keys COUNT_ALLOC: 565645 COUNT_FREE: 565645 SUM_NUMBER_OF_BYTES_ALLOC: 19475083680 SUM_NUMBER_OF_BYTES_FREE: 19475083680 LOW_COUNT_USED: 0 CURRENT_COUNT_USED: 0 HIGH_COUNT_USED: 2 LOW_NUMBER_OF_BYTES_USED: 0 CURRENT_NUMBER_OF_BYTES_USED: 0 HIGH_NUMBER_OF_BYTES_USED: 81984
Now, we have the complete details of the user and its thread id. Let’s see which sort of queries are being executed by this thread.
select * from events_statements_history where THREAD_ID=84 order by SORT_SCAN desc\G; *************************** 1. row *************************** THREAD_ID: 84 EVENT_ID: 48091828 END_EVENT_ID: 48091833 EVENT_NAME: statement/sql/select SOURCE: init_net_server_extension.cc:95 TIMER_START: 145083499054314000 TIMER_END: 145083499243093000 TIMER_WAIT: 188779000 LOCK_TIME: 1000000 SQL_TEXT: SELECT c FROM sbtest2 WHERE id BETWEEN 5744223 AND 5744322 ORDER BY c DIGEST: 4f764af1c0d6e44e4666e887d454a241a09ac8c4df9d5c2479f08b00e4b9b80d DIGEST_TEXT: SELECT `c` FROM `sbtest2` WHERE `id` BETWEEN ? AND ? ORDER BY `c` CURRENT_SCHEMA: sysbench OBJECT_TYPE: NULL OBJECT_SCHEMA: NULL OBJECT_NAME: NULL OBJECT_INSTANCE_BEGIN: NULL MYSQL_ERRNO: 0 RETURNED_SQLSTATE: NULL MESSAGE_TEXT: NULL ERRORS: 0 WARNINGS: 0 ROWS_AFFECTED: 0 ROWS_SENT: 14 ROWS_EXAMINED: 28 CREATED_TMP_DISK_TABLES: 0 CREATED_TMP_TABLES: 0 SELECT_FULL_JOIN: 0 SELECT_FULL_RANGE_JOIN: 0 SELECT_RANGE: 1 SELECT_RANGE_CHECK: 0 SELECT_SCAN: 0 SORT_MERGE_PASSES: 0 SORT_RANGE: 0 SORT_ROWS: 14 SORT_SCAN: 1 NO_INDEX_USED: 0 NO_GOOD_INDEX_USED: 0 NESTING_EVENT_ID: NULL NESTING_EVENT_TYPE: NULL NESTING_EVENT_LEVEL: 0 STATEMENT_ID: 49021382 CPU_TIME: 185100000 EXECUTION_ENGINE: PRIMARY
I have pasted one record only as per rows_scan (which refers to the table scan) here but you can find similar other queries in your case and then try to optimize it either by creating an index or some other suitable solution.
Example Two
Let’s try to find out the situation of table locking i.e. which lock i.e. read lock, write lock, etc., has been put on the user table and for what duration (displayed in pico seconds).
Lock a table with write lock :
mysql> lock tables sbtest2 write; Query OK, 0 rows affected (0.00 sec)
mysql> show processlist; +----+--------+---------------------+--------------------+-------------+--------+-----------------------------------------------------------------+------------------+-----------+-----------+---------------+ | Id | User | Host | db | Command | Time | State | Info | Time_ms | Rows_sent | Rows_examined | +----+--------+---------------------+--------------------+-------------+--------+-----------------------------------------------------------------+------------------+-----------+-----------+---------------+ | 8 | repl | 10.11.139.171:53860 | NULL | Binlog Dump | 421999 | Source has sent all binlog to replica; waiting for more updates | NULL | 421998368 | 0 | 0 | | 9 | repl | 10.11.223.98:51212 | NULL | Binlog Dump | 421998 | Source has sent all binlog to replica; waiting for more updates | NULL | 421998262 | 0 | 0 | | 25 | sbuser | 10.11.54.152:38060 | sysbench | Sleep | 65223 | | NULL | 65222573 | 0 | 1 | | 26 | sbuser | 10.11.54.152:38080 | sysbench | Sleep | 65222 | | NULL | 65222177 | 0 | 1 | | 27 | sbuser | 10.11.54.152:38090 | sysbench | Sleep | 65223 | | NULL | 65222438 | 0 | 0 | | 28 | sbuser | 10.11.54.152:38096 | sysbench | Sleep | 65223 | | NULL | 65222489 | 0 | 1 | | 29 | sbuser | 10.11.54.152:38068 | sysbench | Sleep | 65223 | | NULL | 65222527 | 0 | 1 | | 45 | root | localhost | performance_schema | Sleep | 7722 | | NULL | 7722009 | 40 | 348 | | 46 | root | localhost | performance_schema | Sleep | 6266 | | NULL | 6265800 | 16 | 1269 | | 47 | root | localhost | performance_schema | Sleep | 4904 | | NULL | 4903622 | 0 | 23 | | 48 | root | localhost | performance_schema | Sleep | 1777 | | NULL | 1776860 | 0 | 0 | | 54 | root | localhost | sysbench | Sleep | 689 | | NULL | 688740 | 0 | 1 | | 58 | root | localhost | NULL | Sleep | 44 | | NULL | 44263 | 1 | 1 | | 59 | root | localhost | sysbench | Query | 0 | init | show processlist | 0 | 0 | 0 | +----+--------+---------------------+--------------------+-------------+--------+-----------------------------------------------------------------+------------------+-
Now, think of a situation wherein you are not aware of this session and you are trying to read this table and thus waiting for the meta data locks. In this situation, we need to take the help of instruments (to find out which session is locking this table) related to the lock i.e. wait/table/lock/sql/handler (table_handles is the table responsible for table lock instruments) :
mysql> select * from table_handles where object_name='sbtest2' and OWNER_THREAD_ID is not null; +-------------+---------------+-------------+-----------------------+-----------------+----------------+---------------+----------------+ | OBJECT_TYPE | OBJECT_SCHEMA | OBJECT_NAME | OBJECT_INSTANCE_BEGIN | OWNER_THREAD_ID | OWNER_EVENT_ID | INTERNAL_LOCK | EXTERNAL_LOCK | +-------------+---------------+-------------+-----------------------+-----------------+----------------+---------------+----------------+ | TABLE | sysbench | sbtest2 | 140087472317648 | 141 | 77 | NULL | WRITE EXTERNAL | +-------------+---------------+-------------+-----------------------+-----------------+----------------+---------------+----------------+
mysql> select * from metadata_locks; +---------------+--------------------+------------------+-------------+-----------------------+----------------------+---------------+-------------+-------------------+-----------------+----------------+ | OBJECT_TYPE | OBJECT_SCHEMA | OBJECT_NAME | COLUMN_NAME | OBJECT_INSTANCE_BEGIN | LOCK_TYPE | LOCK_DURATION | LOCK_STATUS | SOURCE | OWNER_THREAD_ID | OWNER_EVENT_ID | +---------------+--------------------+------------------+-------------+-----------------------+----------------------+---------------+-------------+-------------------+-----------------+----------------+ | GLOBAL | NULL | NULL | NULL | 140087472151024 | INTENTION_EXCLUSIVE | STATEMENT | GRANTED | sql_base.cc:5534 | 141 | 77 | | SCHEMA | sysbench | NULL | NULL | 140087472076832 | INTENTION_EXCLUSIVE | TRANSACTION | GRANTED | sql_base.cc:5521 | 141 | 77 | | TABLE | sysbench | sbtest2 | NULL | 140087471957616 | SHARED_NO_READ_WRITE | TRANSACTION | GRANTED | sql_parse.cc:6295 | 141 | 77 | | BACKUP TABLES | NULL | NULL | NULL | 140087472077120 | INTENTION_EXCLUSIVE | STATEMENT | GRANTED | lock.cc:1259 | 141 | 77 | | TABLESPACE | NULL | sysbench/sbtest2 | NULL | 140087471954800 | INTENTION_EXCLUSIVE | TRANSACTION | GRANTED | lock.cc:812 | 141 | 77 | | TABLE | sysbench | sbtest2 | NULL | 140087673437920 | SHARED_READ | TRANSACTION | PENDING | sql_parse.cc:6295 | 142 | 77 | | TABLE | performance_schema | metadata_locks | NULL | 140088117153152 | SHARED_READ | TRANSACTION | GRANTED | sql_parse.cc:6295 | 143 | 970 | | TABLE | sysbench | sbtest1 | NULL | 140087543861792 | SHARED_WRITE | TRANSACTION | GRANTED | sql_parse.cc:6295 | 132 | 156 | +---------------+--------------------+------------------+-------------+-----------------------+----------------------+---------------+-------------+-------------------+-----------------+----------------+
From here we know that thread id 141 is holding the lock “SHARED_NO_READ_WRITE” on sbtest2 and thus we can take the corrective step i.e. either commit the session or kill it, once we realize its requirement. We need to find the respective processlist_id from the threads table to kill it.
mysql> kill 63; Query OK, 0 rows affected (0.00 sec)
mysql> select * from table_handles where object_name='sbtest2' and OWNER_THREAD_ID is not null; Empty set (0.00 sec)
Example Three
In some situations, we need to find out where our MySQL server is spending most of the time waiting so that we can take further steps :
mysql> select * from events_waits_history order by TIMER_WAIT desc limit 2\G; *************************** 1. row *************************** THREAD_ID: 88 EVENT_ID: 124481038 END_EVENT_ID: 124481038 EVENT_NAME: wait/io/file/sql/binlog SOURCE: mf_iocache.cc:1694 TIMER_START: 356793339225677600 TIMER_END: 420519408945931200 TIMER_WAIT: 63726069720253600 SPINS: NULL OBJECT_SCHEMA: NULL OBJECT_NAME: /var/lib/mysql/mysqld-bin.000009 INDEX_NAME: NULL OBJECT_TYPE: FILE OBJECT_INSTANCE_BEGIN: 140092364472192 NESTING_EVENT_ID: 124481033 NESTING_EVENT_TYPE: STATEMENT OPERATION: write NUMBER_OF_BYTES: 683 FLAGS: NULL *************************** 2. row *************************** THREAD_ID: 142 EVENT_ID: 77 END_EVENT_ID: 77 EVENT_NAME: wait/lock/metadata/sql/mdl SOURCE: mdl.cc:3443 TIMER_START: 424714091048155200 TIMER_END: 426449252955162400 TIMER_WAIT: 1735161907007200 SPINS: NULL OBJECT_SCHEMA: sysbench OBJECT_NAME: sbtest2 INDEX_NAME: NULL OBJECT_TYPE: TABLE OBJECT_INSTANCE_BEGIN: 140087673437920 NESTING_EVENT_ID: 76 NESTING_EVENT_TYPE: STATEMENT OPERATION: metadata lock NUMBER_OF_BYTES: NULL FLAGS: NULL 2 rows in set (0.00 sec)
In the above example, bin log file has waited most of the time (timer_wait in pico seconds) to perform IO operations in mysqld-bin.000009. It may be because of several reasons, for example, storage is full. The next records show the details of example two I explained previously.
What else?
To make life more convenient and easy to monitor these instruments, Percona Monitoring and Management (PMM) plays an important role. For example, see the below snapshots.
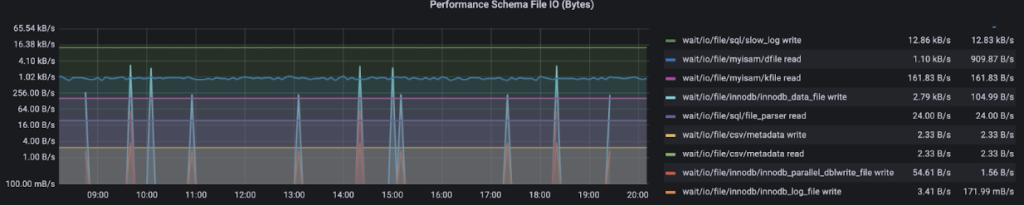
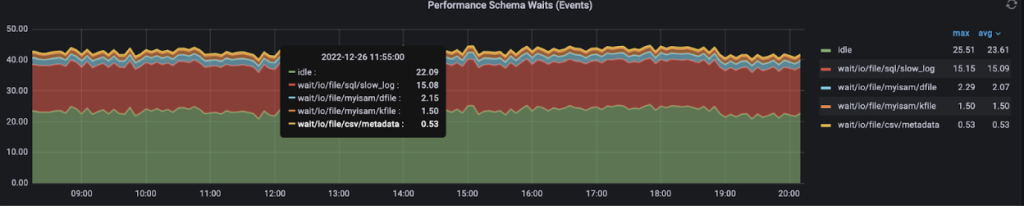
We can configure almost all instruments and instead of querying, we can just make use of these graphs. For getting familiar, check the PMM demo.
Obviously, knowing about performance schema helps us a lot but also enabling all of them incurs additional costs and impacts performance. Hence, in many cases, Percona Toolkit is helpful without impacting the DB performance. For example, pt-index-usage, pt-online schema change, pt-query-digest.
Some important points
- History table loads after a while, not instantly. Only after completion of a thread activity.
- Enabling all instruments may impact the performance of your MySQL as we are enabling more writes to these in-memory tables. Also, it will impose additional money on your budget. Hence enable as per requirements only.
- PMM contains most of the instruments and is also possible to configure more as per your requirements.
- You don’t need to remember the name of all the tables. You can just use PMM or use joins to create the queries. This article hashes the entire concept into smaller chunks and thus didn’t use any joins so that readers can understand it.
- The best method of enabling multiple instruments is in the staging environment and then optimize your findings and then moving to the productions.
Conclusion
Performance schemas are a great help while troubleshooting the behavior of your MySQL server. You need to find out which instrument you need. Should you be still struggling with the performance, please don’t hesitate to reach us and we will be more than happy to help you.
