T-test: The most popular hypothesis test
In today’s data-driven world, data is generated and consumed on a daily basis. All this data holds countless hidden ideas and information that can be exhausting to uncover. Data scientists commonly approach this problem using statistics to make educated guesses about data.
Any testable assumption regarding data is referred to as a hypothesis. Hypothesis testing is a statistical testing method used to experimentally verify a hypothesis. In data science, hypothesis testing examines assumptions on sample data to draw insights about a larger data population.
Hypothesis testing varies based on the statistical population parameter being used for testing. One of the most common problems in statistics is comparing the means between two populations. The most common approach to this is the t-test. In this article, we will discuss about this popular statistical test and show some simple examples in the Python programming language.
What is a T-Test?
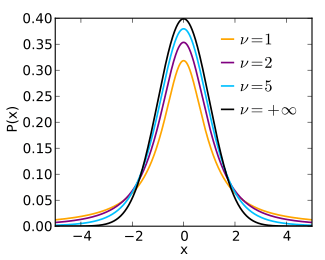
The t-test was developed by William Sealy Gosset in 1908 as Student’s t-test. Sealy published his work under the pseudonym “Student”. The objective of this test is to compare the means of two related or unrelated sample groups. It is used in hypothesis testing to test the applicability of an assumption to a population of interest. T-tests are only applicable to two data groups. If you want to compare more than two groups, then you have to resort to other tests such as ANOVA.

When are T-Tests used?
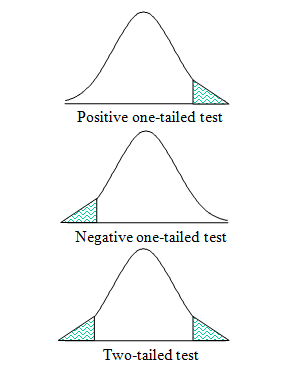
A one-tailed t-test is a directional test that determines the relationship between population means in a single direction, i.e., right or left tail. A two-tailed t-test is a non-directional test that determines if there’s any relationship between population means in either direction.
So when you expect a single value hypothesis, like mean1=mean2, a one-tailed test would be preferable. A two-tailed test makes more sense if your hypothesis assumes means to be greater than or less than each other.

What are the assumptions?
T-tests are parametric tests for determining correlations between two samples of data. T-tests require data to be distributed according to the following assumptions about unknown population parameters:
- Data values are independent and continuous, i.e., the measurement scale for data should follow a continuous pattern.
- Data is normally distributed, i.e., when plotted, its graph resembles a bell-shaped curve.
- Data is randomly sampled.
- Variance of data in both sample groups is similar, i.e., samples have almost equal standard deviation (applicable for a two-sample t-test).
What are the steps involved in T-Tests?
Like any hypothesis test, t-tests are performed in the following order of steps:
- State a hypothesis. A hypothesis is classified as a null hypothesis ( H0) and an alternative hypothesis (Ha) that rejects the null hypothesis. The null and alternate hypotheses are defined according to the type of test being performed.
- Collect sample data.
- Conduct the test.
- Reject or fail to reject your null hypothesis H0.

What are the parameters involved in T-tests?
In addition to group means and standard deviations, there are other parameters in t-tests that are involved in determining the validity of the null hypothesis. Following is a list of those parameters that will repeatedly be mentioned ahead when implementing t-tests:
- T-statistic: A t-test reduces the entire data into a single value, called the t-statistic. This single value serves as a measure of evidence against the stated hypothesis. A t-statistic close to zero represents the lowest evidence against the hypothesis. A larger t-statistic value represents strong evidence against the hypothesis.
- P-value: A p-value is the percentage probability of the t-statistic to have occurred by chance. It is represented as a decimal, e.g., a p-value of 0.05 represents a 5% probability of seeing a t-statistic at least as extreme as the one calculated, assuming the null hypothesis was true.
- Significance level: A significance level is the percentage probability of rejecting a true null hypothesis. This is also called alpha.
What are the different types of T-Tests?
There are three main types of t-tests depending on the number and type of sample groups involved. Let us get into the details and implementation of each type:
1. One-Sample T-Test
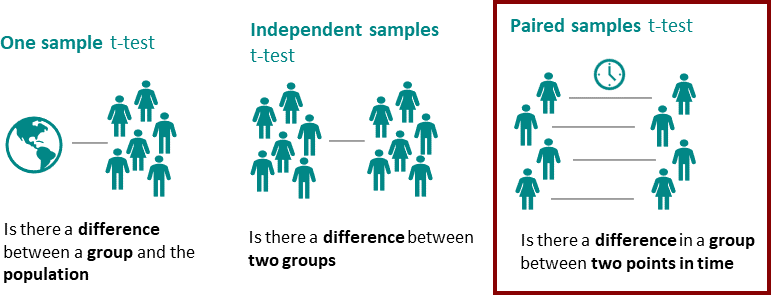
An one-sample t-test compares the mean of a sample group to a hypothetical mean value. This test is conducted on a single sample group, hence the name; one-sample test. The test aims to identify whether the sample group belongs to the hypothetical population.
Formula
t=m-s/nWhere,t= T-statisticm= group mean= preset mean value (theoretical or mean of the population)s= group standard deviationn= size of group
Implementation
Step 1: Define hypotheses for the test (null and alternative)
State the following hypotheses:
- Null Hypothesis (H0): Sample mean (m) is less than or equal to the hypothetical mean. (<=m)
- Alternative Hypothesis (Ha): Sample mean (m) is greater than the hypothetical mean. (>m)
Step 2: Import Python libraries
Start with importing required libraries. In Python, stats library is used for t-tests that include the ttest_1samp function to perform a one-sample t-test.
import numpy as np from scipy import stats from numpy.random import seed from numpy.random import randn from numpy.random import normal from scipy.stats import ttest_1samp
Step 3: Create a random sample group
Create a random sample group of 20 values using the normal function in the numpy.random library. Setting the mean to 150 and standard deviation to 10.
seed=(1) sample =normal(150,10,20) print(‘Sample: ‘, sample)
Step 4: Conduct the test
Use the ttest_1samp function to conduct a one-sample t-test. Set the popmean parameter to 155 according to the null hypothesis (sample mean<=population mean). This function returns a t-statistic value and a p-value and performs a two-tailed test by default. To get a one-tailed test result, divide the p-value by 2 and compare against a significance level of 0.05 (also called alpha).
t_stat, p_value = ttest_1samp(sample, popmean=155) print(“T-statistic value: “, t_stat) print(“P-Value: “, p_value)
A negative t-value indicates the direction of the sample mean extreme, and has no effect on the difference between sample and population means.
Step 5: Check criteria for rejecting the null hypothesis
For the null hypothesis, assuming the sample mean is lesser than or equal to the hypothetical mean:
- Reject the null hypothesis if p-value <= alpha
- Fail to reject the null hypothesis if p-value > alpha
- Reject or fail to reject hypothesis based on result
The results indicate a p-value of 0.21, which is greater than = 0.05, failing to reject the null hypothesis. So this test concludes that the sample mean was less than the hypothetical mean.
2. Two-Sample T-test
A two-sample t-test, also known as an independent-sample test, compares the means of two independent sample groups. A two-sample t-test aims to compare the means of samples belonging to two different populations.
Formula
t=mA- mBs2nA+s2nBWhere,mA and mB = means of the two samplesnA and nB = sizes of the two sampless2 = common variance of the two samples
Implementation
Step 1: Define the hypotheses (null and alternative)
State the following hypotheses for significance level =0.05:
- Null Hypothesis (H0): Independent sample means (m1 and m2) are equal. (m1=m2)
- Alternative Hypothesis (Ha): Independent sample means (m1 and m2) are not equal. (m1!=m2)
Step 2: Import libraries
Start with importing required libraries. Like previously, stats library is used for t-tests that include the ttest_ind function to perform independent sample t-test (two-sample test).
from numpy.random import seed from numpy.random import randn from numpy.random import normal from scipy.stats import ttest_ind
Step 3: Create two independent sample groups
Using the normal function of the random number generator to create two normally distributed independent samples of 50 values, different means (30 and 33), and almost the same standard deviations (16 and 18).
# seed the random number generator seed(1) # create two independent sample groups sample1= normal(30, 16, 50) sample2=normal(33, 18, 50) print(‘Sample 1: ‘,sample1) print(‘Sample 2: ‘,sample2)
Step 4: Conduct the test
Use the ttest_ind function to conduct a two-sample t-test. This function returns a t-statistic value and a p-value.
t_stat, p_value = ttest_ind(sample1, sample2) print(“T-statistic value: “, t_stat) print(“P-Value: “, p_value)
Step 5: Check criteria for rejecting the null hypothesis
For the null hypothesis, assuming sample means are equal:
- Reject the null hypothesis if p-value <= alpha
- Fail to reject the null hypothesis if p-value > alpha
- Reject or fail to reject each hypothesis based on the result
The results indicate a p-value of 0.04, which is less than alpha=0.05, rejecting the null hypothesis. So this two-sample t-test concludes that the mean of the first sample is either greater or less than the mean of the second sample.
3. Paired T-Test

A paired t-test, also known as a dependent sample test, compares the means of two related samples. The samples belong to the same population and are analyzed under varied conditions, e.g., at different points in time. This test is mostly popular for pretest/posttest type of experiments where a sample is studied before and after its conditions are varied with an experiment.
Formula
t=ms/nWhere,t= T-statisticm= group means= group standard deviationn= size of group
Implementation
Step 1: Define hypotheses (null and alternative)
State the following hypotheses for significance level =0.05:
- Null Hypothesis (H0): Dependent sample means (m1 and m2) are equal (m1=m2).
- Alternative Hypothesis (Ha): Dependent sample means (m1 and m2) are not equal (m1!=m2)
Step 2: Import Python libraries
Start with importing required libraries. Import the ttest_rel function from the stats library to perform a dependent sample t-test (paired t-test).
from numpy.random import seed from numpy.random import randn from numpy.random import normal from scipy.stats import ttest_rel
Step 3: Create two dependent sample groups
For simplicity, use the same random samples from the two-sample implementation. We can assume the samples are from the same population.
# seed the random number generator seed(1) # create two dependent sample groups sample1= normal(30, 16, 50) sample2=normal(33, 18, 50) print(‘Sample 1: ‘,sample1) print(‘Sample 2: ‘,sample2)
Step 4: Conduct the test
Use ttest_rel function to conduct a two-sample t-test on two dependent/related samples. This function returns a t-statistic value and a p-value.
t_stat, p_value = ttest_rel(sample1, sample2) print(“T-statistic value: “, t_stat) print(“P-Value: “, p_value)
Step 5: Check criteria for rejecting the null hypothesis
For the null hypothesis assuming sample means are equal:
- Reject the null hypothesis if p-value <= alpha
- Fail to reject the null hypothesis if p-value > alpha
- Reject or fail to reject hypothesis based on result
The results indicate a p-value of 0.05, which is equal to 0.05, hence rejecting the null hypothesis. So this paired t-test concludes that the mean of the first sample is either greater or less than the mean of the second sample.
Why are t-tests useful in data analysis?
The t-test is a versatile tool. Data scientists use these tests to verify their data observations and the probability of those observations being true. It is a tried-and-tested approach to comparing observations without the overhead of involving the entire population data in the analysis.
From testing the purchase numbers of a new product to comparing economic growth among countries, hypothesis tests are an important statistical tool for businesses and one of the most important tools in a statistician’s arsenal. Wherever data is involved, t-tests will play an essential role in validating data findings.
If you are interested in pursuing a career in data science, make sure to check out Beyond Machine!
The post How to Do a T-test in Python? appeared first on Datafloq.

