Why do data quality metrics matter?
If you’re in data, you’re either currently working on a data quality project or you just wrapped one up. It’s the law of bad data – there’s always more of it.
Traditional methods of measuring data quality metrics are often time and resource-intensive, spanning several variables, from accuracy (a no-brainer) and completeness, to validity and timeliness (in data, there’s no such thing as being fashionably late). But the good news is there’s a better way to approach data quality metrics.
Data downtime – periods of time when your data is partial, erroneous, missing, or otherwise inaccurate – is an important data quality metric for any company striving to be data-driven.
It might sound clich, but it’s true – we work hard to collect, track, and use data, but so often we have no idea if the data is actually accurate. In fact, companies frequently end up having excellent data pipelines, but terrible data. So what’s all this hard work to set up a fancy data architecture worth if at the end of the day, we can’t actually use the data?
By measuring data downtime, this simple data quality KPI will help you determine the reliability of your data, giving you the confidence necessary to use it or lose it.
The North Star data quality metric
Overall, data downtime is a function of the following data quality metrics:
- Number of data incidents (N) – This factor is not always in your control given that you rely on data sources “external” to your team, but it’s certainly a driver of data uptime.
- Time-to-detection (TTD) – In the event of an incident, how quickly are you alerted? In extreme cases, this quantity can be measured in months if you don’t have the proper methods for detection in place. Silent errors made by bad data can result in costly decisions, with repercussions for both your company and your customers.
- Time-to-resolution (TTR) – Following a known incident, how quickly were you able to resolve it?
By this method, a data incident refers to a case where a data product (e.g., a Looker report) is “incorrect,” which could be a result of a number of root causes, including:
- All/parts of the data are not sufficiently up-to-date
- All/parts of the data are missing/duplicated
- Certain fields are missing/incorrect
Here are some examples of things that are not a data incident:
- A planned schema change that does not “break” any downstream data
- A table that stops updating as a result of an intentional change to the data system (deprecation)
Bringing this all together, I’d propose the right formula for data downtime is:
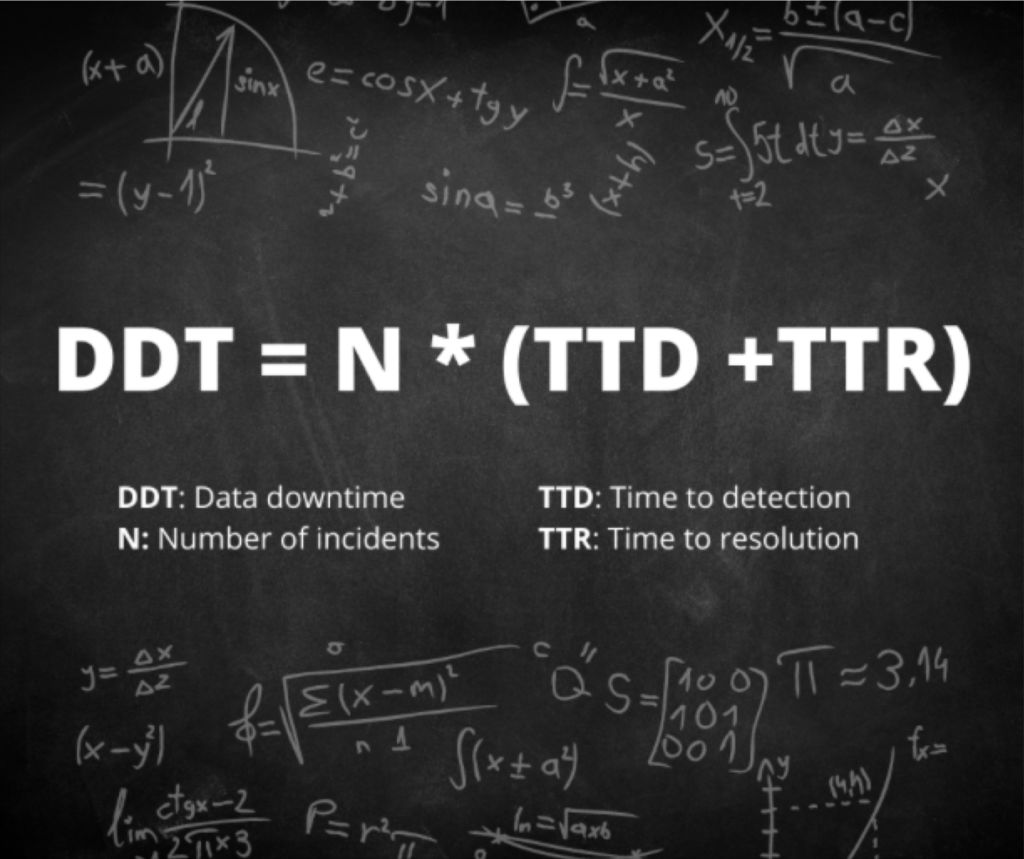
Data downtime is an effective data quality metric. It is measured by the number of data incidents multiplied by the average time to detection plus the average time to resolution.
Data downtime is an effective data quality metric. It is measured by the number of data incidents multiplied by the average time to detection plus the average time to resolution.
If you want to take this data quality KPI a step further, you could also categorize incidents by severity and weight uptime by level of severity, which we have addressed in another post.
With the right combination of automation, advanced detection, and seamless resolution, you can minimize data downtime by reducing TTD and TTR. There are even ways such as data SLAs and data health insights to reduce N.
11 More Important Data Quality Metrics
Of course, if we hold that data downtime is our north star data quality KPI, then all of the data points that make up the formula are important as well. For example:
1. Total number of incidents (N)
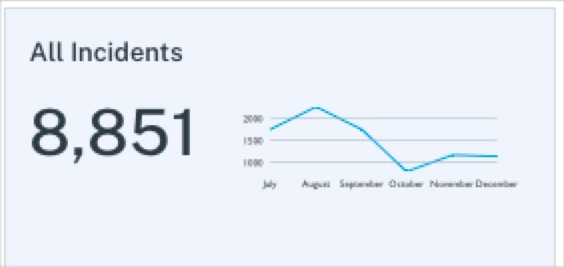
This metric measures the number of errors or anomalies across all of your data pipelines. A high number of incidents indicates areas where more resources need to be dedicated towards optimizing the data systems and processes. However, it’s important to keep in mind that depending on your level of data quality maturity, more data incidents can be a good thing. It doesn’t necessarily mean you HAVE more incidents, just that you are catching more.
2. Table uptime:
It is important to place the total number of incidents within the larger context of table uptime or the percentage of tables without an incident. This can be filtered by type of incident, by custom data freshness rules for example, to get a broad look at SLA adherence.
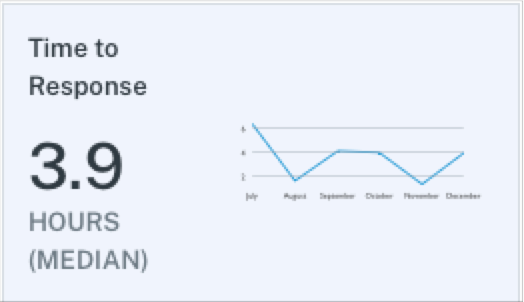
3. Time to response (detection):
This metric measures the median time from an incident being created until a member of the data engineering team updates it with a status (which would typically be “investigating,” but could also be expected, no action needed, or false positive).
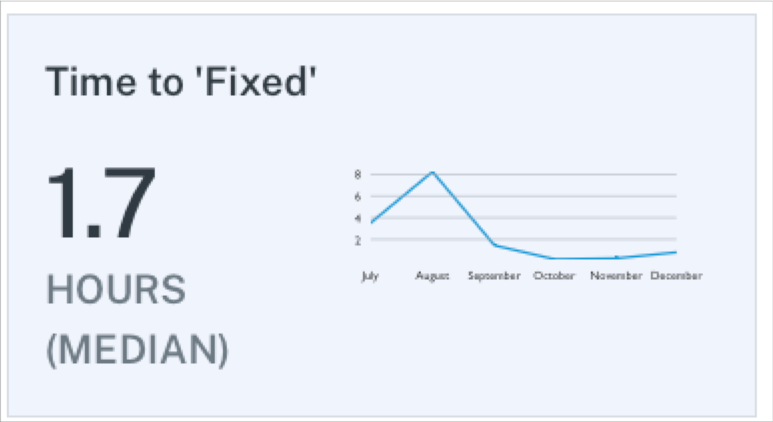
4. Time to fixed (resolution):
Once an incident has been given a status, we then want to understand the median time from that moment until the status is updated to fixed.
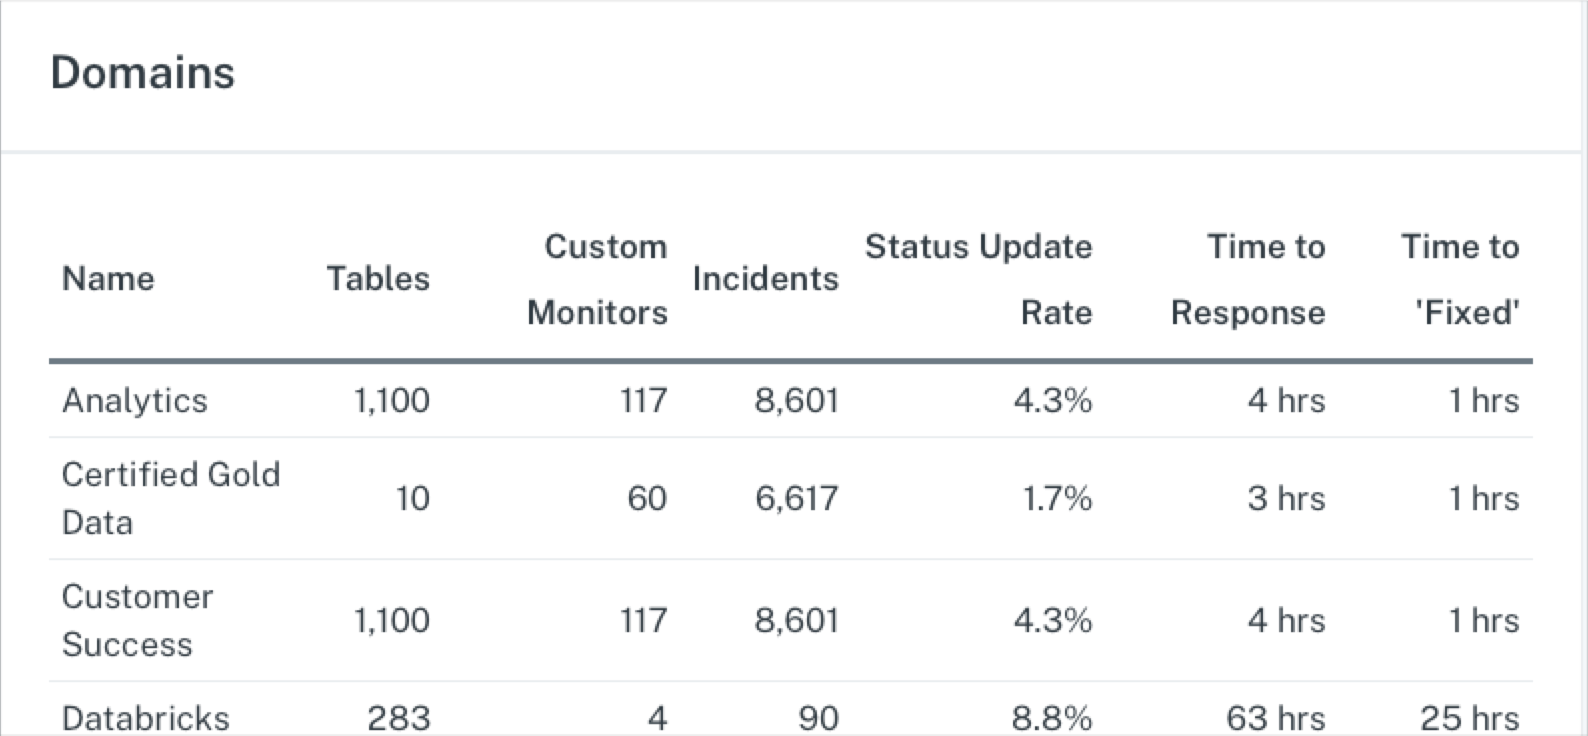
Sort by domain:
It’s important to measure the above data quality metrics by domain to understand the areas where additional optimization may be needed.
Other types of data quality metrics are important as well, including those that measure table reliability, scope of monitoring coverage, tidiness, and incident response.
First let’s look at table reliability metrics:
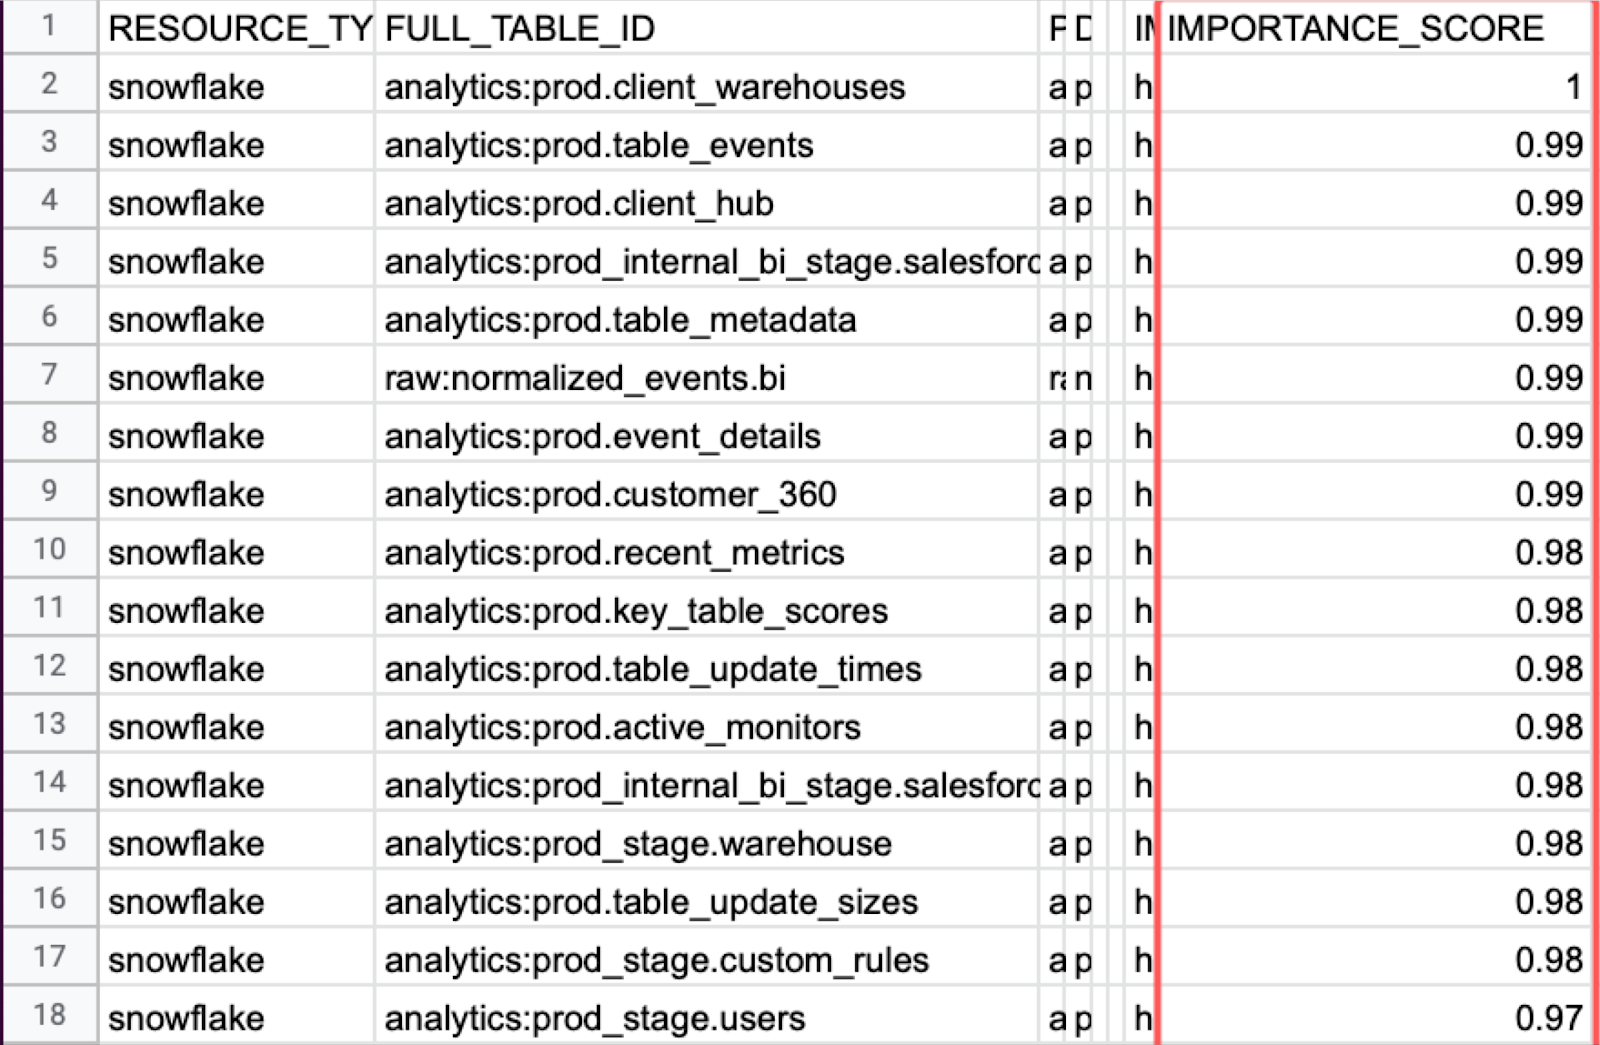
5. Importance Score:
Risk is a combination of frequency and severity. You can’t understand the severity of a data incident if you don’t also understand how important the underlying table is. Importance score, measured by the number of read/writes as well as downstream consumption at the BI level via data lineage, is an important part of enabling data engineers to triage their incident response. It can also indicate a natural starting place for where layering on more advanced custom monitoring, data tests, or data contracts may be appropriate.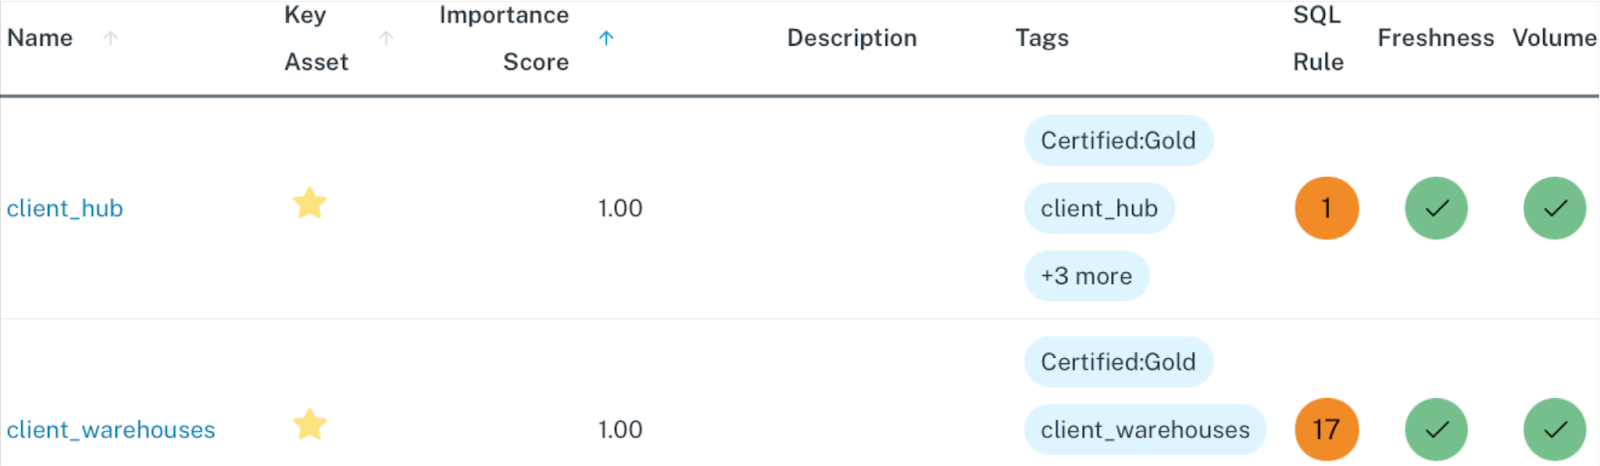
6. Table health:
If the importance score is the severity, the table health, or number of incidents a table has experienced over a certain time period provides the frequency end of the risk equation.
Now let’s look at scope of data monitoring coverage:
7. Table Coverage:
Having comprehensive coverage across as many of your production tables as possible is critical to ensuring data reliability. This is because data systems are so interdependent. Issues from one table flow into others. With a data observability platform, your coverage across data freshness, data volume, and schema change monitors should be at or near 100% (but that’s not true for all modern data quality solutions).
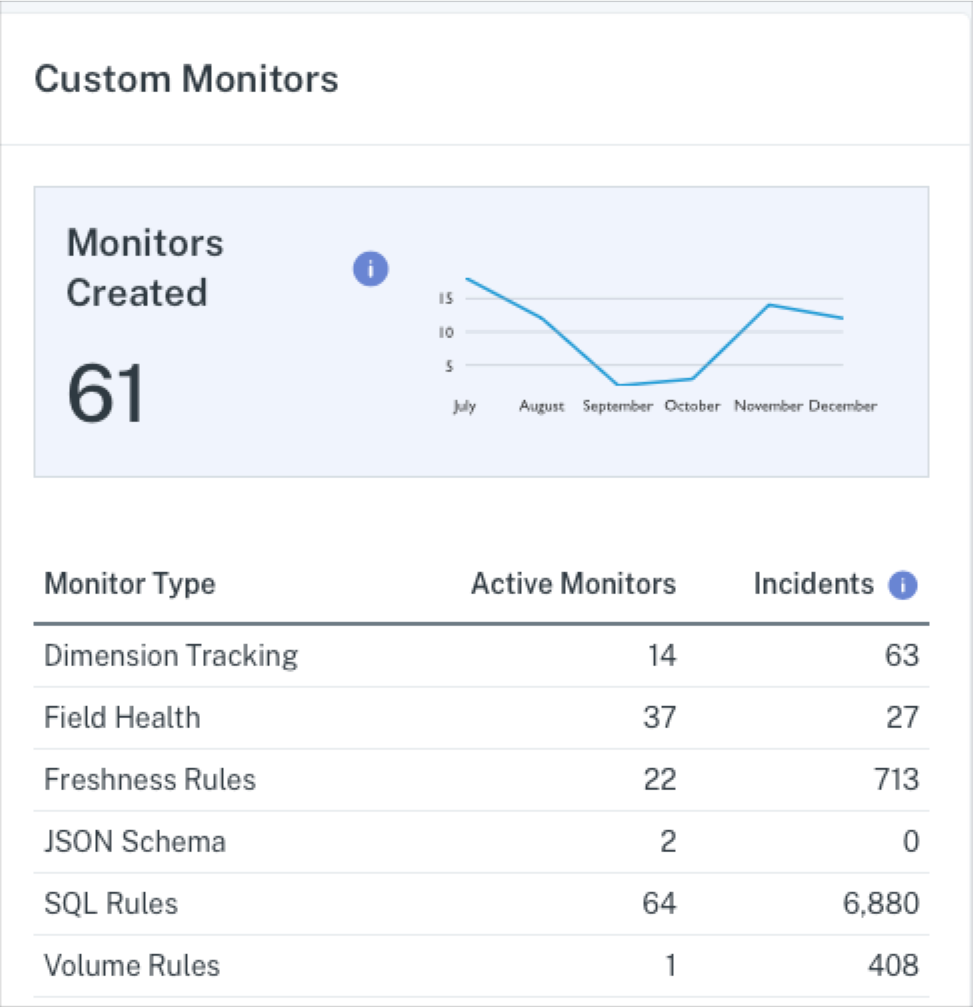
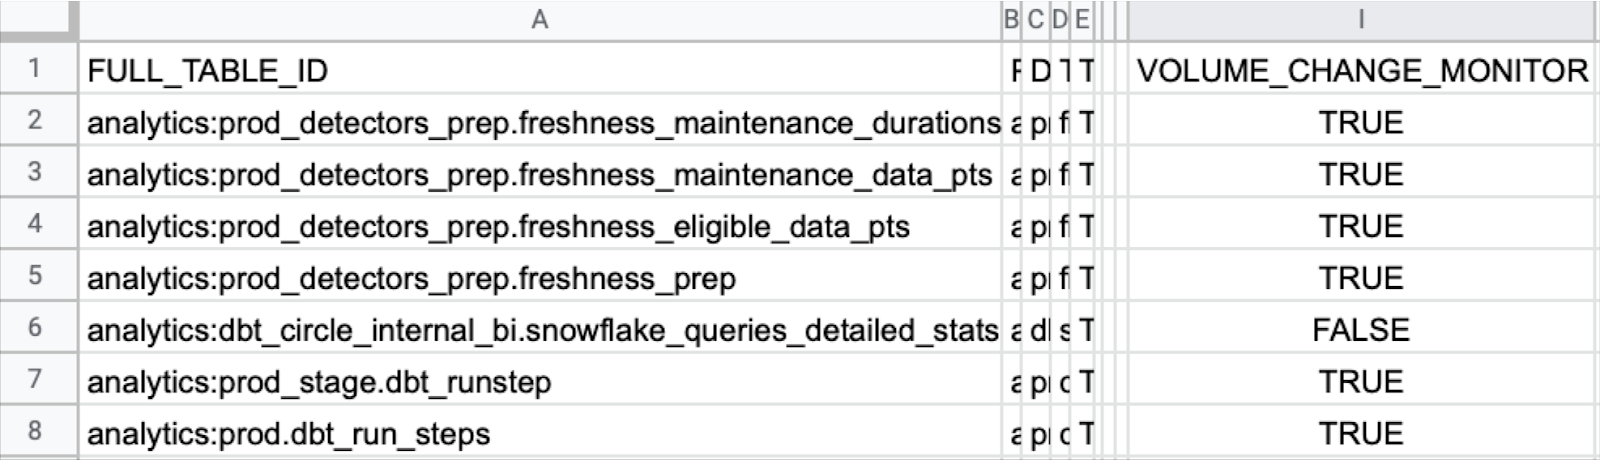
8. Custom Monitors Created:
Table coverage helps you ensure you have a broad base of coverage across as many of your production tables as possible. Data engineering teams can get additional coverage by creating custom monitors on key tables or fields. It is important to understand the number of incidents being created by each custom monitor type to avoid alert fatigue.
Now let’s look at, for lack of a better word, “tidiness” data quality metrics. Tracking and understanding these metrics can help you reduce incidents related to poor organization, usability, and overall management.
9. Number of unused tables and dashboards:
It can take some guts to deprecate tables and dashboards. Because it’s easier to just leave them lying around, unused tables and dashboards quickly accumulate. This can make it hard to find data, or worse, your stakeholders might end up leveraging the wrong table or dashboard resulting in two sources of truth (one of which was meant to be retired).
10. Deteriorating queries:
Measured as queries displaying a consistent increase in execution runtime over the past 30 days. It is important to catch these deteriorating queries before they become failed queries and a data incident.
Finally, we covered key incident response metrics that comprise data downtime, but we’ll add one more below.
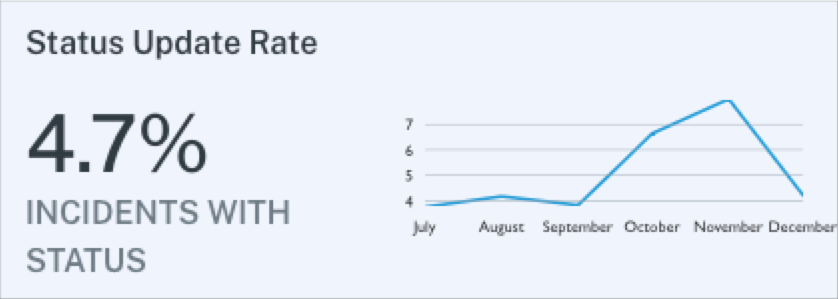
11. Status update rate:
The better your team is at updating the status of incidents, the better your incident response will be.
Focusing on the data quality metrics that matter
Tracking key data quality metrics is the first step in understanding data quality, and from there, ensuring data reliability. With fancy algorithms and data quality KPIs flying all over the place, it’s easy to overcomplicate how to measure data quality.
Sometimes it’s best to focus on what matters. But to do that, you need the systems and processes in place to measure (ideally in a dashboard) the many data metrics that comprise your overall data health.
The post 12 Data Quality Metrics That ACTUALLY Matter appeared first on Datafloq.
